
The W.D. Gann Method
In October 1909, W.D. Gann made 286 trades in 25 market days. 264 were profitable. A 92% strike rate, executed in front of a magazine reporter and verified by an independent auditor. Two decades later, a CPA audit of his 1933-34 account showed 83.7% accuracy across 135 trades. No trader in history has a documented record quite like it – and a century later, most people still study the wrong part of his work.
This guide opens the entire method: the money-management rules his fortune was actually built on, the Square of Nine reduced to a calculation you can run on a pocket calculator, and the full framework applied to real Indian market data – where it called a RELIANCE top within 1%, caught a Tata Power correction low within 3 points, and where, tested honestly across five years, it also failed. By the end, you will know exactly what works in Gann, what does not, and why. Education only – no recommendations, no targets, no tips.
W.D. Gann’s Principles
Who was Gann – and the single biggest lesson
W.D. Gann was an American trader (1878-1955). His track record was audited by an independent CPA: 135 trades in 1933-34 with 83.7% accuracy, and in another audit 362 trades with a 93% return on capital. In his famous documented month of October 1909, 264 of 286 trades were profitable. This is not folklore – it is documented (CPA letter from Joseph Zittrer).
The biggest lesson: most people think Gann’s edge was his charts and astrology. It was not. His real, verifiable money came from discipline – stop-losses, position sizing and trend-following. That is why the reading order matters: discipline first (Tier 1), then geometry (Tier 2), then modern books (Tier 3), and astrology last (Tier 4).
Three rules before you start
- Rule 1: Read Tier 1 for discipline, not prediction. Every one of Gann’s verified results came from stop-losses and position sizing, not mysticism.
- Rule 2: Treat the geometry as arithmetic you can check yourself. Do the worked examples by hand before trusting any charting software.
- Rule 3: Keep the astrology at arm’s length until everything else works – it is the least verifiable and most divided part of the literature.
Six ideas that unlock everything else
| Concept | Plain meaning |
|---|---|
| 1. Squaring Price & Time | When the TIME elapsed (in days) since a top or bottom becomes equal to the PRICE level itself, a trend change is due. Example: a low forms at 53 – watch day 53. “When price and time are squared, look for a change in trend.” |
| 2. Gann Angles | Trendlines from an important high/low at a fixed speed. The 1×1 (45 degrees) = 1 point per day is the baseline. Full set: 8×1 (82.5), 4×1 (75), 3×1 (71.25), 2×1 (63.75), 1×1 (45), 1×2 (26.25), 1×3 (18.75), 1×4 (15), 1×8 (7.5 degrees). |
| 3. Square of Nine | Numbers spiral outward from a centre value. The 90/180/270/360-degree points give price targets; the diagonals hold the square numbers as natural resistance. Formula: target = (sqrt(n) + k) squared. (Explained from zero in Part B.) |
| 4. Hexagon Chart | Rings that grow by 6 per lap: 1, 7, 19, 37, 61, 91, 127, 169, 217, 271, 331, 397. A time-cycle counter: 127 = about 10 years 7 months; 169 = 14 years. Multiples of 66 months (5.5 years) also mark culminations. |
| 5. Time Cycles | Nested periods Gann tracked: 3, 5, 7, 10, 20, 30, 49-50, 60 and 90 years, plus monthly/weekly sub-cycles (23-24 months, 49-52 days). “Time is the most important factor… it will overbalance both space and volume.” In short: TIME > PRICE > VOLUME. |
| 6. Law of Vibration | Every stock has its own internal “rate of vibration” (speed), set by its starting trend, from which future support/resistance can be computed. “Lost motion”: price typically overshoots a level by only ~1-7/8 points – hence the standard 3-point stop. |
Discipline & Money Management (start here)
Gann’s own six books, in this order. This is where his verified record actually came from:
- How to Trade (in Stocks), 1935 – START HERE. Only 5 pages, the densest rules in the corpus: nine checks before every trade, a hard 3-point stop-loss ceiling, and the pyramiding sequence. “Never let a mistake grow into a disaster… Practice trading on paper until you thoroughly understand how to determine the trend.”
- Wall Street Stock Selector, 1930. The “24 Never-Failing Rules” plus pyramiding by reaction size: measure the stock’s typical pullback (3/5/7/10/12 points) and add on that increment. A fast 6-7 week move, or an 85-100 point run in a short span, is itself a top/bottom warning.
- Gann’s 28 Trading Rules. A 2-page checklist for after every closed trade: never average a loss (#13), be as willing to short as to buy (#18), pyramid only in confirmed trends (#20-21), never hedge – exit instead (#22), cut size after a loss (#27).
- Master Stock Market Course – THE SPINE. 464 pages: the full angle set, the 50%-retracement buy rule, stop-sizing by price band (Rs 10 stock = 1-point stop; Rs 20-30 = 2; Rs 90-150 = 3). Keep five chart resolutions – Yearly, Monthly, Weekly, 3-Day, Daily – with MONTHLY as the primary trend indicator.
- New Stock Trend Detector, 1936. Buy near single/double/triple bottoms with a stop 3 points below; if price crosses an old top by 3+ points, buy the next reaction. Volume rules: heavy volume at the end of a rapid advance = culmination; volume drying up near a low = accumulation.
- 45 Years in Wall Street, 1949 – MOST MATURE. The eighths percentage rule (12.5 / 25 / 37.5 / 50 / 62.5 / 75 / 87.5% of a move as resistance – 50% and 100% strongest), the 3-week rule for normal reactions, and recurring monthly turn windows (Jan 7-10 & 19-24, Mar 20-27, July 7-20 & 21-27).
Core Discipline Rules in One Place
| Rule | Detail |
|---|---|
| The 10-parts rule | Divide capital into 10 equal parts; risk at most 1 part (10%) per trade. Keep 3+ months of margin in reserve. |
| The 3-point stop | Never more than 3 points from entry (think roughly 2-3% today). 5-7 points only in fast/panic markets. |
| Profit/loss asymmetry | Never risk 3-5 points to make only 3-5 points. Small stop, larger target. |
| Never average a loss | Buying more of a falling stock is the biggest mistake. A loss means you are wrong – exit first. |
| Never hedge | Do not open an opposite position to hedge a loss – book it and get out. |
| Cut size after a loss | The next trade after a loss is SMALLER. Revenge trading destroys accounts. |
| Never let a profit become a loss | In profit? Move the stop to breakeven or better. Do not sit on hope. |
| The trend is the boss | Uptrend = buy side only; downtrend = short willingly; unclear = stay out. “Stocks are never too high to buy as long as the trend is up.” |
| Pyramiding | Add only after profit + a new high/low confirms; add on the stock’s own pullback increment; never within 3 points of a double top/bottom; only in confirmed trends. |
| 50% + eighths | Divide any move into 8 parts – each level is support/resistance; 50% and 100% strongest. |
| Volume rules | Heavy volume at a rally’s end = top forming. Volume drying near a low = accumulation. |
| The 3-week rule | A bull-market dip (or bear-market rally) normally runs ~3 weeks. |
| The checklist habit | After every loss, find which of the 28 rules you broke. Paper-trade first. |
Geometry
The clearest technical thread: McLaren -> the 1931 Sq9/Hexagon notes -> Smithson. Key documents: McLaren’s essay (angle construction + the Sq9 shortcut: 180-degree objective = (sqrt(n)+1) squared, 360-degree = (sqrt(n)+2) squared); Gann’s own 1931 notes (the Sq9 as both resistance locator and time-cycle calculator; Hexagon rings to 397); Smithson’s Law of Vibration reconstruction (a 6-step method – fix the start point, identify the driving cycle, anchor angles to set the vibration rate, forecast the expiry date and price, monitor for reversion; his worked example: 1909 wheat at 0.1053 cents/day forecast a $1.20 close – hit to the cent); On Tops and Bottoms (the year-division rule: turning points at 6.5, 13, 18.5, 26, 32.5, 39, 45.5 and 52 weeks); and On Cycles & Trading (the full cycle doctrine – 20 years is “the most important cycle”; daily trend changes cluster around the 6th-7th, 9th-10th, 14th-15th, 19th-20th, 23rd-24th and 29th-31st of each month).
Modern Translators (pick 2-3, not all)
- Gann Simplified (Clif Droke, 2001) – the true beginner entry; excludes Sq9 and astrology; range x 3 and x 5 price targets.
- Pattern, Price & Time (James Hyerczyk) – the best second book; organises all of Gann into pattern/price/time, with Gann’s real handwritten charts.
- An Introduction to the Methods of W.D. Gann (Bryce Gilmore, 1996) – the tightest formulas; five explicit squaring methods; solar-degree time counting.
- Fibonacci and Gann Applications (George MacLean, 2005) – deliberately astrology-free; only the chartable geometry.
- Gann Masters I & II, The Patterns of Gann (Cooley), and Costa’s 2001 paper – advanced or specialised; read later.
Astrological Layer (optional; read as hypothesis, not doctrine)
This is the “hidden system” claim: that Gann’s real edge was planetary longitude converted into price. A clear warning: this is the LEAST verifiable tier, and its authors disagree with each other more than they agree. Only two sources publish an actual formula: Mikula (the most rigorous – decodes Gann’s 1941 commodities book via the word “natural” flagging 151 astro-dates, with real price-to-zodiac conversion tables) and Bost (the only explicit longitude-to-price arithmetic: zodiac position to a “Power Number”, then decimal shifts and 360-degree increments). Long (Mercury-Sun conjunction pairs), Ledeboer (Jupiter-Saturn cycle history, no technique) and Stewart (formula withheld as proprietary) complete the tier. Do not touch this layer until Tiers 1-2 work for you.
Chart Annuals – Study Them, Don’t “Read” Them
Gann’s own hand-annotated working charts survive (1914-1957). July Wheat 1935-36 shows his literal “Sell / Buy / Raise Stops” markup – the stop-raising discipline live. Nov Beans Weekly and December Cotton Monthly show the angle-fan method across seven years. May Soybeans shows explicit calendar-span counting between historic dates. Corn Cycles overlays several years at fixed offsets to show the same shape recurring roughly every 10 years. After Tiers 1-2, trace every annotation back to the rule that produced it – far faster than re-reading prose.
Listing data – a stock’s “birth certificate”
Gann believed a stock’s “horoscope” is fixed on its LISTING DAY – the first trading date, first traded price, and the listing day’s high and low. Three practical uses: (1) Permanent support/resistance – the listing day’s levels keep working for the stock’s entire life; a broken listing low = weak, a reclaimed listing high = very bullish; the “50% of the all-time high” rule counts from listing. (2) The Law of Vibration’s start point – the first big move after listing sets the stock’s natural speed, which repeats in later cycles. (3) The First Trade Horoscope (Tier 4) – the planetary positions at the listing moment as a natal chart; the least verifiable use. For IPOs: note the listing day’s low and high – they are your first Gann levels for years to come.
Square of Nine, From Zero
First, the square root
A square root answers one question: which number, multiplied by itself, gives this number? 10 x 10 = 100, so the square root of 100 is 10. That is all.
What the Square of Nine actually is
On paper, write 1 in the middle, then write 2, 3, 4, 5… around it, going round and round:
17  16  15  14  13
18   5   4   3  12
19   6   1   2  11
20   7   8   9  10
21  22  23  24  25
1 sits in the middle; 2 beside it; 3, 4, 5 curl upward; 6, 7, 8, 9 come back down – the first lap completes at 9 (hence the name). Then 10-25 is the second lap, 26-49 the third, and so on. That is all the Sq9 is – a way of writing numbers in a circular spiral.
Squares on the Corners
Look at the diagonal: 1, 9, 25 (then 49, 81 on later rings) – the odd squares. The other diagonal holds the even squares (16, 36, 64, 100, 144). Every full lap around the spiral lands you back on a square number. Gann noticed this and claimed market prices also pause at these lap-completion points.
Where the degrees come from – think of a clock
A clock hand’s full round = 360 degrees; half a round = 180. Picture the spiral as a clock face: half a lap forward = 180 degrees, a full lap = 360, three and a half laps = 1260. “1260 degrees” just means: go 3.5 laps further along the spiral. No astrology – just a count of rotation.
Formula
A full lap (360°) lands on: (√n + 2)²
Check it on the grid: start at 4 (root = 2). A full lap = (2+2) squared = 16 – and on the grid, 16 sits directly above 4, one ring out. The formula holds. That is why traders never draw the spiral – root + add + square on a calculator is enough.
Example – a Low at Rs 100
Step 2: 10 + 1 = 11
Step 3: 11 × 11 = 121 — the first major resistance
Next: 12 × 12 = 144, 13 × 13 = 169
Ladder: 100 → 121 → 144 → 169
Direction rule: rising stock – ADD from the low (targets above). Falling stock – take the HIGH’s root and SUBTRACT (supports below).
Historical Illustration: RELIANCE (actual NSE data)
Real 2-year daily data (NSE via Yahoo Finance; as of 17-Jul-2026). Purely educational – no recommendation, no view, no target.
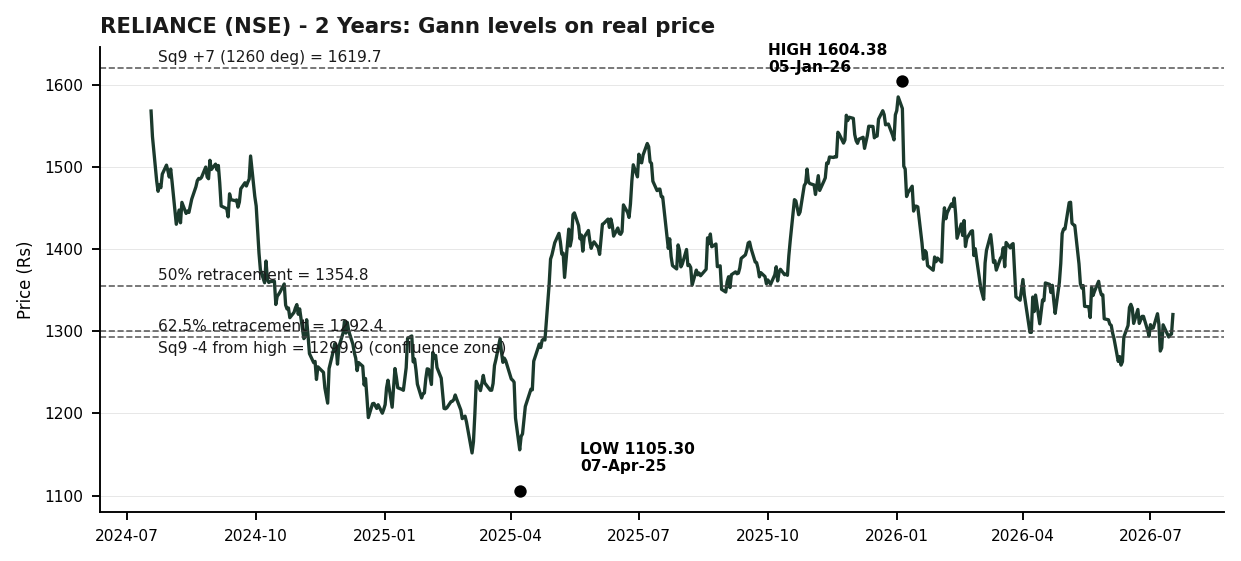
The data: 2-year LOW Rs 1,105.30 (07-Apr-2025); 2-year HIGH Rs 1,604.38 (05-Jan-2026); close Rs 1,320.70; range Rs 499.08 points in 273 calendar days.
Eighths retracement
| Level | Price (Rs) | Note |
|---|---|---|
| 12.5% | 1,542.00 | first support |
| 25% | 1,479.61 | |
| 37.5% | 1,417.23 | |
| 50% | 1,354.84 | Gann’s most important level |
| 62.5% | 1,292.45 | next reference if 50% breaks |
| 75% | 1,230.07 | |
| 87.5% | 1,167.68 | the last level – beyond this lies a full retrace |
Price had moved below the 50% level – so the method’s next reference was 62.5% = Rs 1292. From just TWO numbers, a complete level map.
Square of Nine Ladder
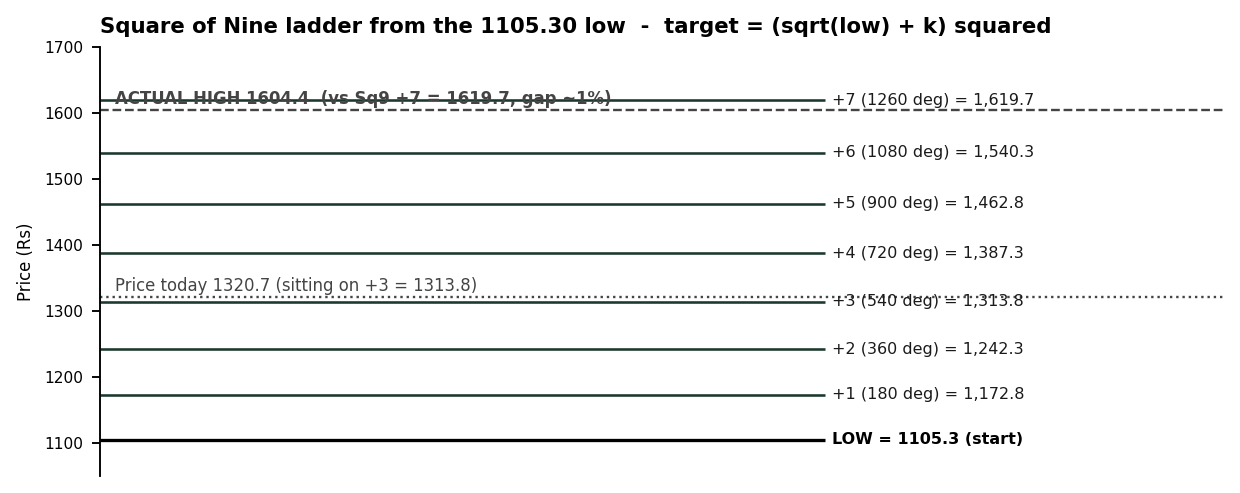
sqrt(1105.30) = 33.246. Add 1 to 7 and square back: 1,172.79 / 1,242.28 / 1,313.78 / 1,387.27 / 1,462.76 / 1,540.25 / 1,619.74.
- The last rung caught the top: Sq9 +7 = 1619.74 vs the actual high 1604.38 – a ~1% gap, computable months in advance.
- The close sat on a rung: +3 = 1313.78 vs the close 1320.70.
- Downside: sqrt(1604.38) = 40.05; (40.05-4) squared = 1,299.94.
- CONFLUENCE: two different formulas – eighths (1292.45) and Sq9 (1299.94) – pointed at the same zone, Rs 1292-1300. Confluence zones are treated as the strongest levels in the framework.
Vibration, angles and time
Vibration rate: up-move 499.08 points / 273 days = 1.83 points/day; the fall ran at 1.47 points/day – slower than the rise, reading as a controlled correction rather than a reversal. Angles: at the stock’s natural rate, the 1×1 line stood near Rs 1,957 and the 1×2 near Rs 1,531 – price below both, i.e. travelling on slower angles. Time squares: high + 90/180/270/360 days = 05-Apr / 04-Jul / 02-Oct / 31-Dec-2026; and the signature price=time squaring: the move was 499 points, so low + 499 days = 19-Aug-2026. These dates are the mechanical output of the method – not forecasts.
Three Inputs Together
A Gann student reads PRICE (levels and confluence), TIME (the counts and squarings) and SPEED (current rate vs natural rate) together – and above all of it sits Tier-1 discipline. Which trade to take, and when, is every trader’s own decision – this guide teaches only the framework.
Honest Note
Count the levels we generated: 1168, 1230, 1242, 1292, 1300, 1313, 1355, 1387, 1417, 1462, 1480… with this many levels, price will always stop “near” one. That is the strongest criticism of Gann methods – and exactly why you must check the geometry by hand. The levels only tell you WHERE TO LOOK; the money is made by discipline. Gann’s audited record came from the combination: a setup at a level + a tight stop + letting winners run. That asymmetry is the entire game.
Historical backtest case studies – Tata Power & Cupid (5 years)
A hypothetical, hindsight-based mechanical backtest (Sq9/old-top-cross entry + 50%-break exit + 3% stop) on two real stocks. No current view, recommendation or target on either stock.
| Tata Power (500400) | Cupid (530843) | |
|---|---|---|
| Company CAGR (buy & hold) | 24.9% | 143% (a multibagger) |
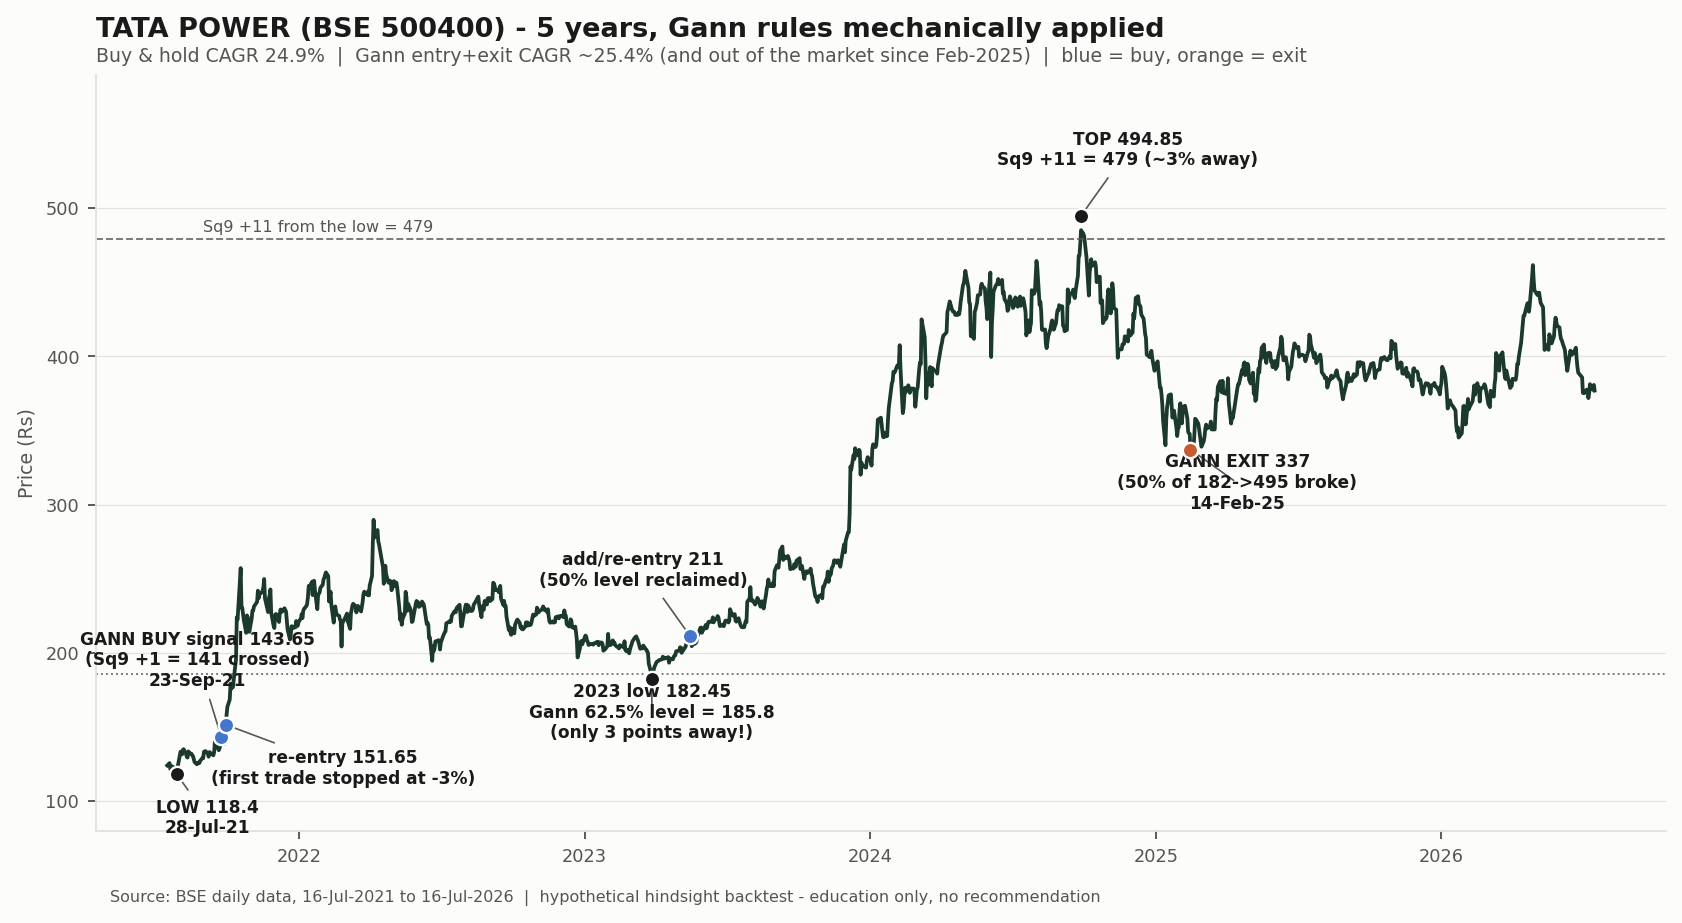
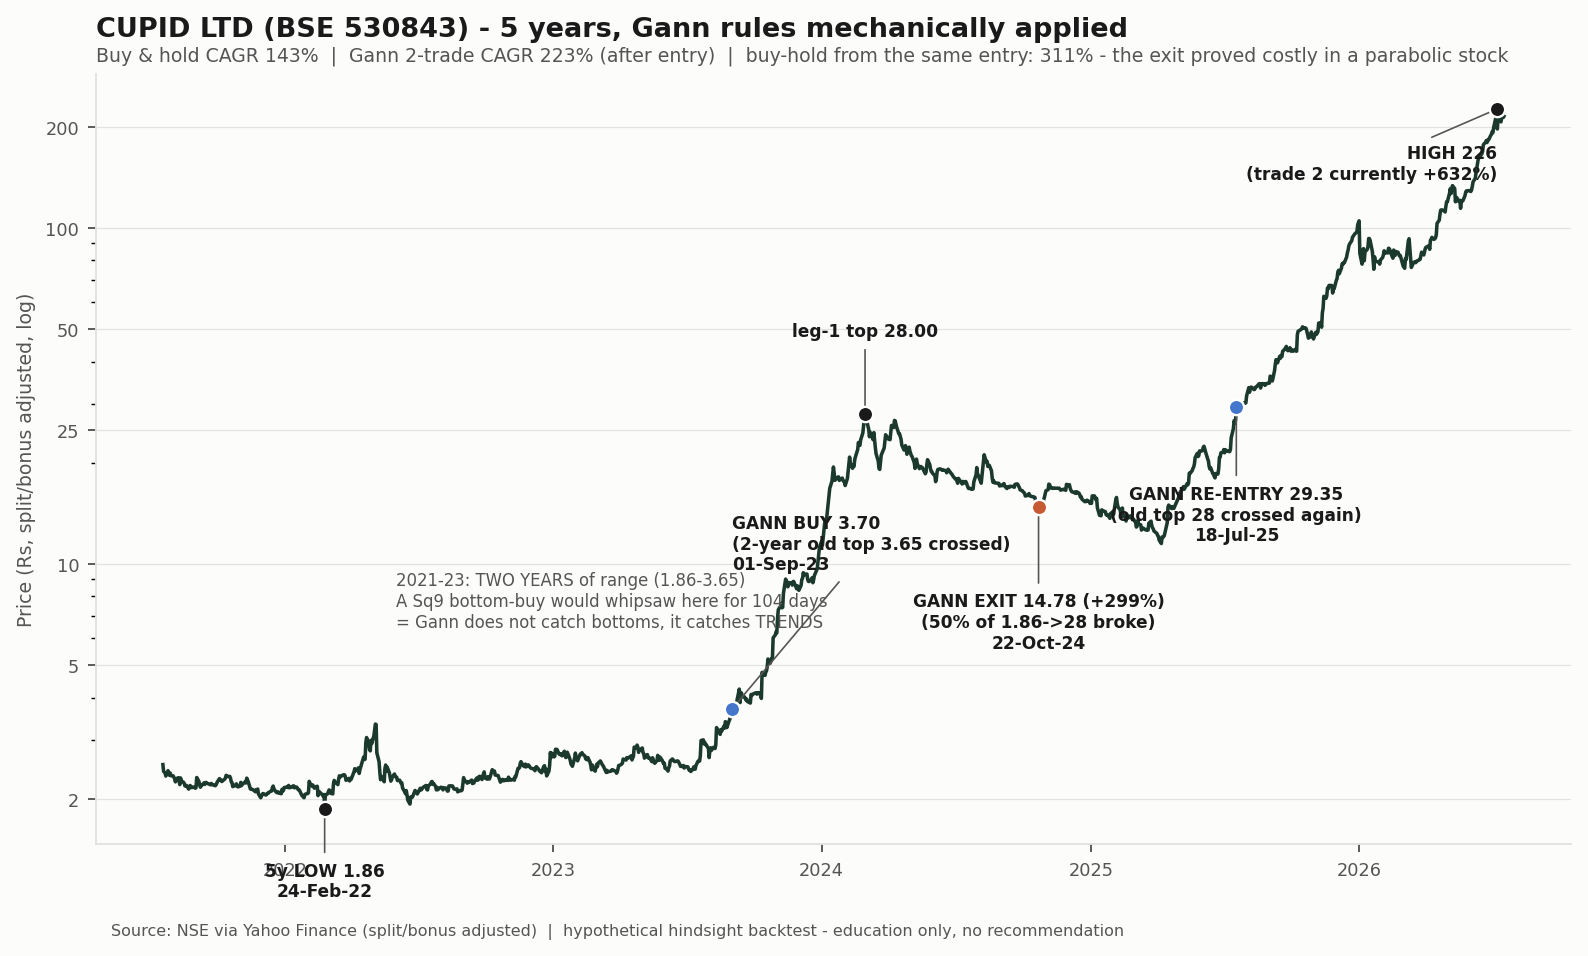
| Backtest entry signal | 23-Sep-21 @ 143.65 (Sq9 +1 = 141 crossed; 2 months after the 118.4 low). First trade stopped at -3%, re-entry 151.65 | 01-Sep-23 @ 3.70 (2-year old top crossed; 99% above the low – it caught the TREND, not the bottom) |
| Backtest exit signal | 14-Feb-25 @ 337 (50% of 182-495 broke), after the 494.85 top | 22-Oct-24 @ 14.78 (+299%); re-entry signal 18-Jul-25 @ 29.35 |
| Backtest CAGR | ~25.4% – slightly better than buy & hold, with less time in the market | ~223% – excellent, BUT below holding (311%): in a parabolic stock the exit rule proved costly |
| What the levels caught | The 2023 low 182.45 vs the 62.5% level 185.8 (3 points!); the top 494.85 vs Sq9 +11 = 479 (~3%) | In the 2021-23 range a Sq9 bottom-buy would have whipsawed for 104 days – Gann fails in a range, works in a trend |
The takeaway: Gann does not CREATE returns – the company does (24.9% vs 143%). The method provides a framework for entering on confirmation, holding with structure, and exiting when the trend dies. Two data lessons: raw BSE CSVs are NOT split-adjusted – always compute returns on adjusted data; and every backtest is hindsight – assume real-time results will be weaker.
Veridian Wealth Research is an independent equity research desk. SEBI Research Analyst registration application pending. This article is for education only – it contains no investment advice, recommendation, rating or target price. All stock examples are historical illustrations; past performance is not indicative of future results. Trading involves risk of capital loss. For more research: research@veridianwealth.in | www.veridianwealth.in